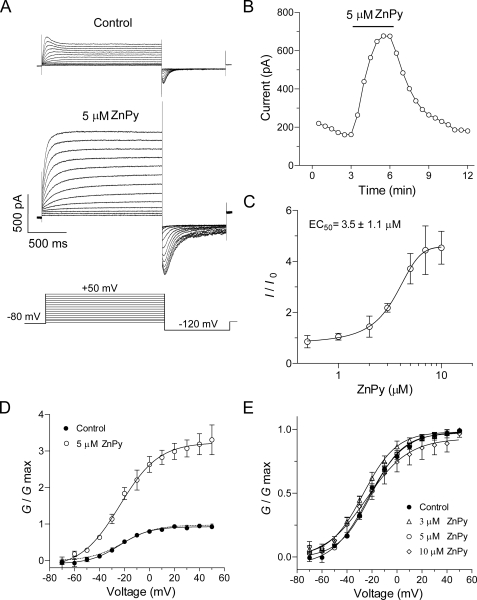
FIGURE 1.
ZnPy potentiates KCNQ1 homomultimers expressed in CHO cells. A, the representative traces of the KCNQ1 currents before and after application of 5 μm ZnPy. The cell was held at -80 mV. The KCNQ1 currents were elicited by a series of voltage steps from -70 mV to +50 mV in 10-mV increments (inset). Scale bars and voltage-step protocol are as indicated. B, time course of a representative KCNQ1 peak current in the presence of 5 μm ZnPy. C, concentration-potentiation curve of ZnPy (n > 3). D, conductance-voltage curves of KCNQ1 in the absence or presence of ZnPy (5 μm). The conductance at each depolarized voltage (from -70 to +50 mV) was normalized to the conductance at +50 mV in the control (n > 3). The dashed line is a fit curve in the presence of ZnPy after rescaling Gmax to 1. E, conductance-voltage curves after application of the indicated concentrations of ZnPy (n > 3).

