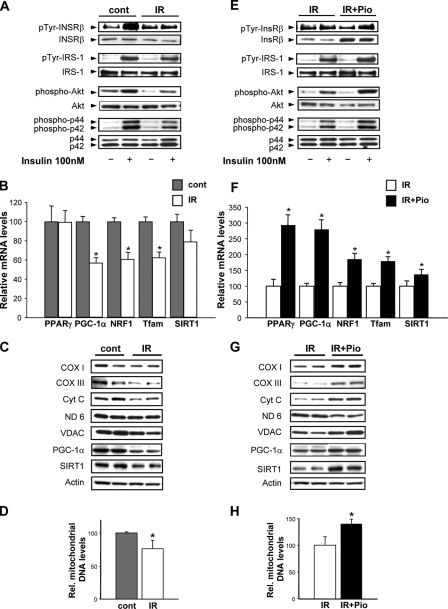
FIGURE 1.
Insulin signaling and mitochondrial phenotype in response to insulin resistance and pioglitazone. Control myotubes were exposed to 25 mm glucose, and the insulin resistant myotubes were exposed to 40 mm glucose and 100 nm insulin for 48 h. A represents insulin-responsive signaling as shown by the representative Western blots (pTyr, phosphotyrosine; cont, control; IR, insulin resistance). B, transcript levels, expressed as % control, of genes encoding for mitochondrial regulatory proteins (PPARγ, peroxisome proliferator-activated receptor γ; NRF1, nuclear respiratory factor 1; Tfam, mitochondrial transcription factor A and SIRT1. C, steady-state mitochondrial electron transfer chain protein levels (COX I and III, cytochrome c oxidase subunits I and III; Cyt c, cytochrome c; ND 6, NADH dehydrogenase, subunit 6; VDAC, voltage-dependent anion channel) as well as levels of voltage-activated anion channel, SIRT1, and actin as a housekeeping protein; D, relative mitochondrial genomic copy number (% control). E shows insulin-responsive signaling comparing insulin-resistant to pioglitazone (Pio)-treated insulin-resistant myotubes. F, transcript levels, expressed as % control, of genes encoding for mitochondrial regulatory proteins. G, steady-state mitochondrial electron transfer chain protein levels comparing insulin-resistant to insulin-resistant myotubes exposed to pioglitazone. H, relative mitochondrial genomic copy number (% control). The asterisk represents a p < 0.05 versus the respective control in this and all subsequent figures (unless otherwise stated).

