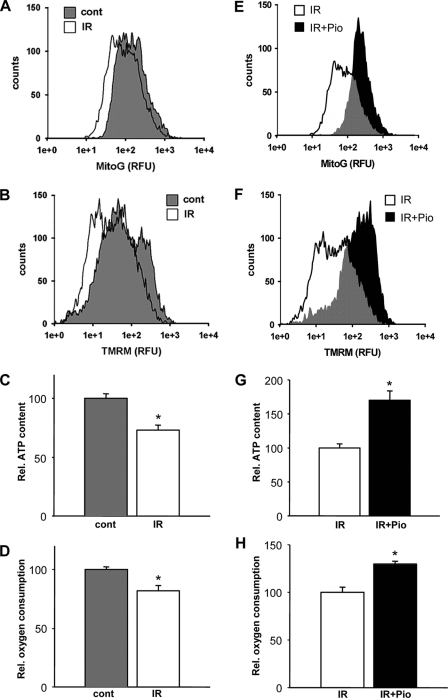
FIGURE 2.
Insulin resistance and pioglitazone modulation of mitochondrial biology. The mitochondrial bioenergetic profile was compared between control and insulin-resistant myotubes and to the administration of pioglitazone. Results are representative cytometric profile of MitoTracker green, which represents that relative mitochondrial size (A), and tetramethylrhodamine methyl ester (TMRM), which represents the relative mitochondrial membrane potential (% control) (B) comparing control to insulin-resistant cells. C, total cellular ATP levels. D, the relative rate of oxygen consumption (% control). E, comparing insulin resistant cells to those exposed to pioglitazone (Pio) showing a representative cytometric profile of MitoTracker green fluorescence depicting the relative mitochondrial size. F, tetramethylrhodamine methyl ester represents the relative mitochondrial membrane potential (% insulin-resistant controls). G, total cellular ATP levels. H, relative rate of oxygen consumption (% insulin-resistant controls). RFU, relative fluorescent units.

