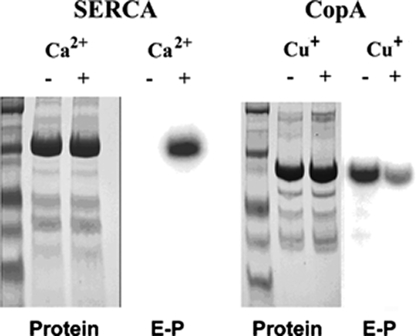
FIGURE 5.
Electrophoretic analysis of Ca2+-ATPase (SERCA) and CopA following phosphorylation with [γ-32P]ATP. The gels were either stained with Coomassie Blue to evidence protein bands, or scanned with a phosphorimager to detect radioactive phosphoenzyme. The reaction with 25 μm [γ-32P]ATP was allowed to proceed under conditions yielding the highest steady state levels of phosphorylation for each protein. SERCA, 5 s in ice in the presence of 50 mm MOPS, pH 7, 80 mm KCl, 1 mm MgCl2, and 20 μm CaCl2 or 1 mm EGTA. CopA, 3 min at 60 °C, in the presence of 50 mm MES/triethanolamine, pH 6.0, 30% glycerol, 0.5 mm DTT, 10 mm cysteine/Tris, pH 6.0, 5 mm MgCl2, 0.01% DDM, 25 μg/ml phosphatidylcholine, and either 1 mm BCS or 40 μm CuCl2. See “Materials and Methods” for details.

