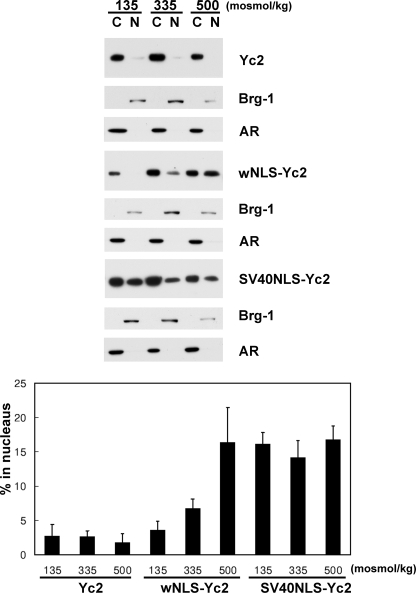
FIGURE 10.
Nuclear distribution of Yc2, wNLS-Yc2, and SV40NLS-Yc2. Cytoplasmic and nuclear fractions were prepared from COS7 cells transfected and treated with different osmolalities, as described in the legend to Fig. 9. The cytoplasmic and nuclear fractions were loaded at a 1:4 ratio and immunoblotted for Myc and loaded at 1:1 ratio and immunoblotted for Brg-1 and aldose reductase (AR) as described in the legend to Fig. 4. The intensity of the Myc signal was quantified and expressed as percentage in the nucleus: 100 × (intensity in N)/((4 × intensity in C) + intensity in N) (mean ± S.D., n = 3). In wNLS-Yc2, all three values are different from each other (p < 0.05; Student's t test), whereas there are no statistical differences in Yc2 or SV40NLS-Yc2.

