
Figure 3.
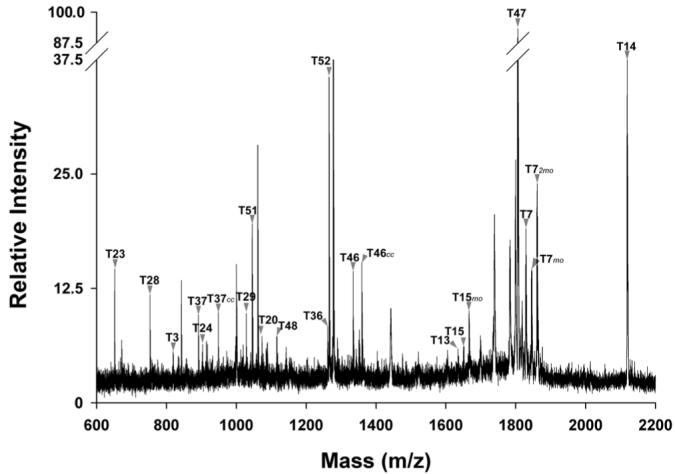
MALDI-TOF MS spectrum of oatp1a1 tryptic digest. The peptide digest was mixed with α-CHCA matrix saturated in 50% acetonitrile and 0.1% TFA. This representative spectrum was acquired in positive reflector mode. Tryptic peptides of oatp1a1 as illustrated in Figure 1 are indicated. The peaks were assigned either manually or automatically using peptide match software in ProFound. cc: carbamidomethylation; mo: methionine sulfoxidation.