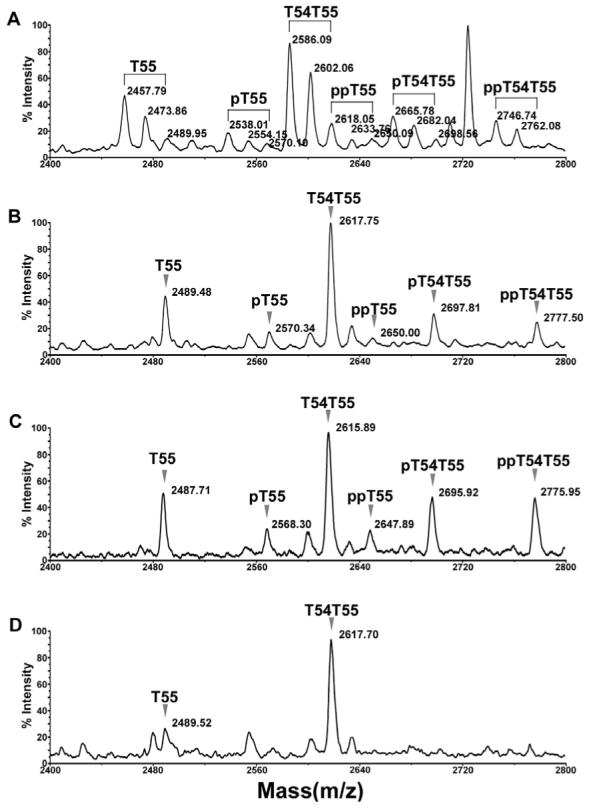
Figure 5.

Confirmation of phosphorylation on oatp1a1 peptide T55. A. Spectrum of oatp1a1 tryptic digest showing the clusters of T55 peaks with different levels of methionine oxidation and phosphorylation. The spectrum was acquired in positive linear mode. B. Improvement of spectral resolution following methionine oxidation. The oatp1a1 digest was incubated with 30 mM H2O2 in 0.1% acetic acid at 37°C for 30 min to fully oxidize methionine residues. The sample was then processed with a C18 Ziptip and analyzed by MALDI-TOF in positive linear mode. C. Spectrum acquired in negative linear mode from the same MALDI target spot as in panel B, showing the increased relative intensity of phosphorylated peptides. D. On-target alkaline phosphatase treatment of the sample loaded on the same spot as in panel B. The sample was dissolved in 1.5 μl of a solution containing 0.075 U of alkaline phosphatase in 50 mM ammonium bicarbonate. The target was incubated at 37°C for 30 min. 0.5 μl of 1% acetic acid was added to acidify the matrix for recrystallization and subsequent MALDI analysis. pT55, pT54T55: the singly phosphorylated forms of T55 and T54T55, respectively. ppT55, ppT54T55: the doubly phosphorylated forms of T55 and T54T55, respectively.
