
Fig. 5.
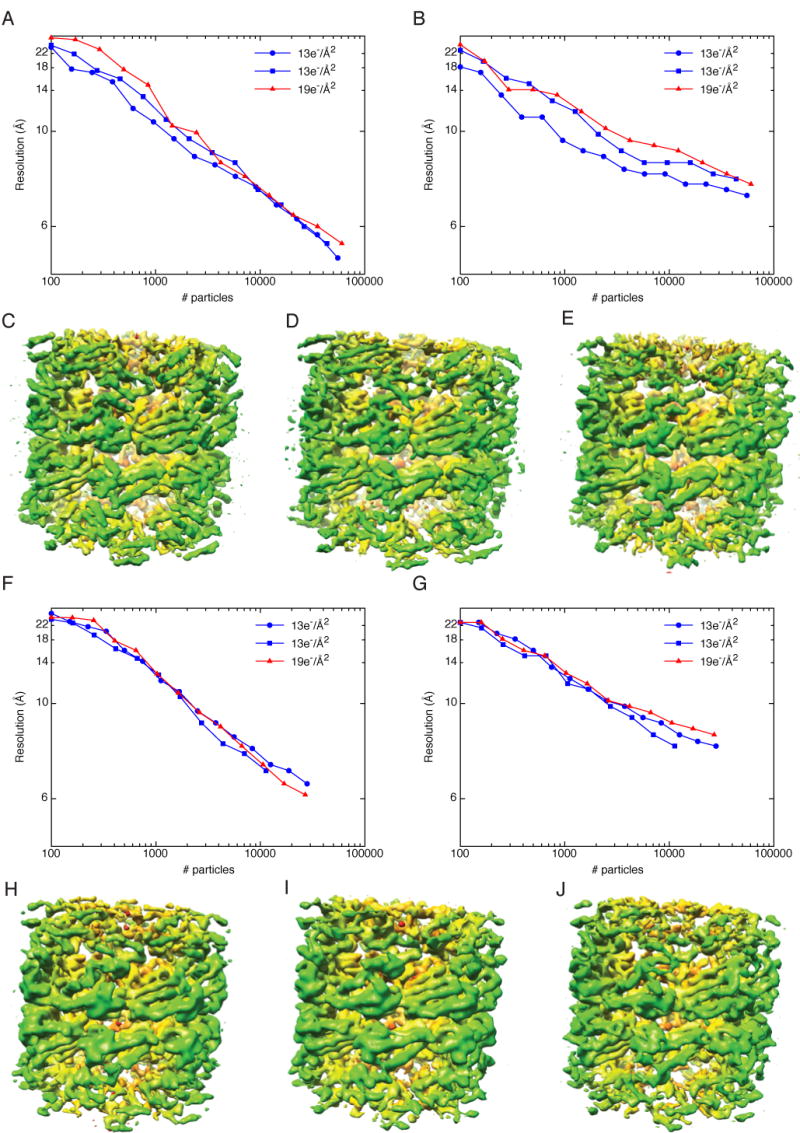
Variations between datasets and the influence of dose on resolution. Panels A-E are for data collected at 120keV and F-J are for data collected at 200keV. A) Plot of resolution as a function of number of particles for data collected at 120keV and 100,000X. Two datasets were acquired with a dose of 13e-/Å2 (blue curves) while the third was acquired with a dose of 19e-/Å2 (red curve). Resolution was estimated by the FSC0.5 criterion. B) Same as A, but resolution was estimated by rmeasure. C,D) The highest-resolution 3D reconstructions for the data collected with a dose of 13e-/Å2. E) The highest-resolution 3D reconstructions for the data collected with a dose of 19e-/Å2. F) Plot of resolution as a function of number of particles for data collected at 200keV and 100,000X. Two datasets were acquired with a dose of 13e-/Å2 (blue curves) while the third was acquired with a dose of 19e-/Å2 (red curve). Resolution was estimated by the FSC0.5 criterion. G) Same as A, but resolution was estimated by rmeasure. H,I) The highest-resolution 3D reconstructions for the data collected with a dose of 13e-/Å2. J) The highest-resolution 3D reconstructions for the data collected with a dose of 19e-/Å2.