
Fig. 8.
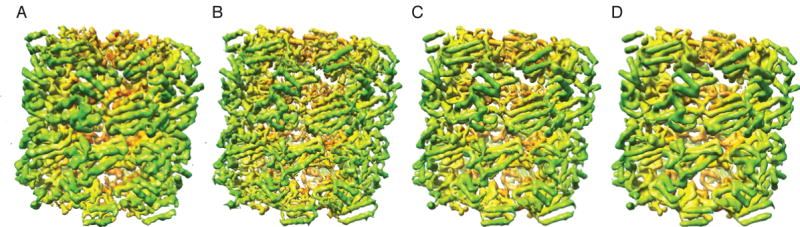
Comparison of the details of the highest-resolution EM map and maps generated from an X-ray crystal structure. A) Surface representation of our GroEL reconstruction with the highest-resolution. B) X-ray map filtered to 5.4Å resolution. C) X-ray map filtered to 6.9Å resolution. D) X-ray map filtered to 8.1Å resolution.