
Fig. 8.
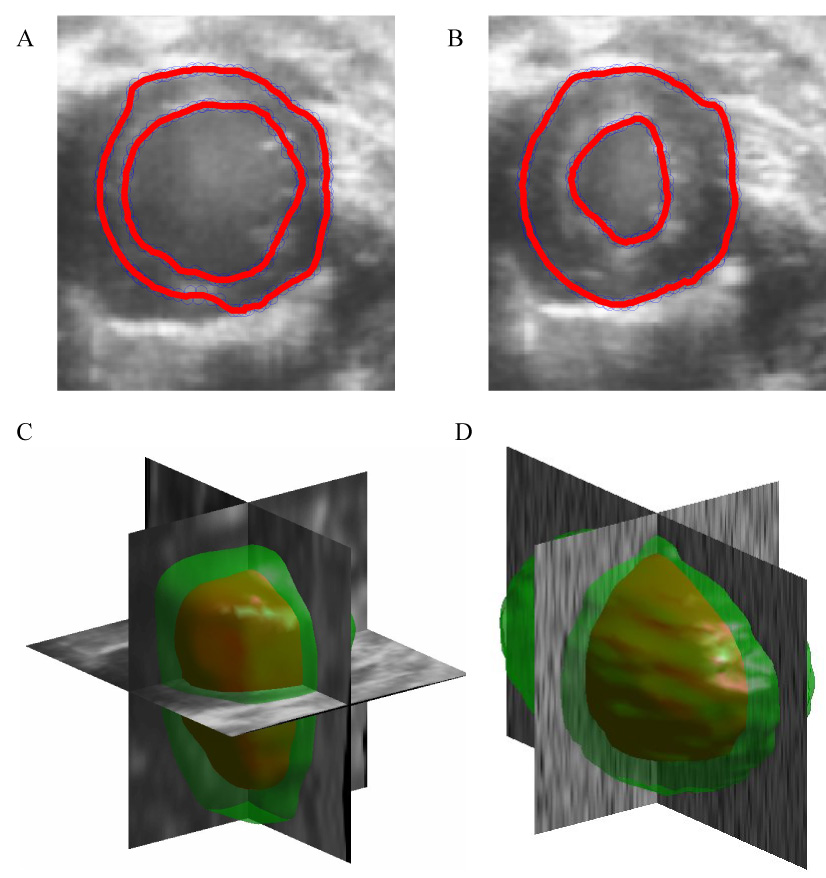
8A and 8B illustrate 2D short-axis slices of well-converged models at end diastole and end systole, respectively, resulting from a GVF weighting parameter μ of 0.10 and a temporal time step τ of 0.17. 8C and 8D illustrate full 3D reconstructions of the synthetic and in vivo data for optimal values of μ and midpoint (synthetic) and optimal (in vivo) values of τ, as predicted by the conservation of volume metric.