Figure 5.

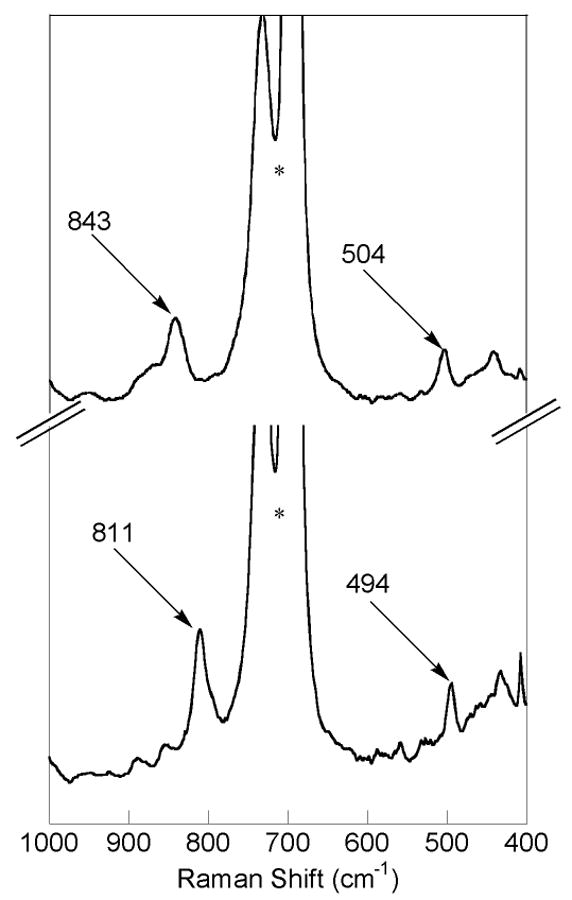
Resonance Raman spectra of a CH2Cl2 solution of 1b derived from the oxygenation [Fe(O2CArTol)2(2-Hspy)2] (6a) with 16O2 (top spectrum) and 18O2 (bottom spectrum). The asterisk indicates a solvent band.

Resonance Raman spectra of a CH2Cl2 solution of 1b derived from the oxygenation [Fe(O2CArTol)2(2-Hspy)2] (6a) with 16O2 (top spectrum) and 18O2 (bottom spectrum). The asterisk indicates a solvent band.