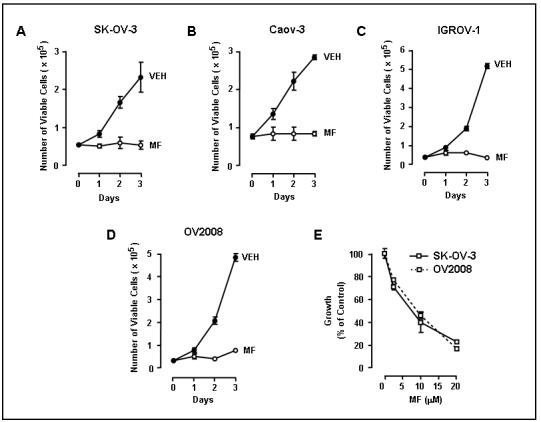
Fig. 2.

Inhibition of cell growth by mifepristone in various ovarian cancer cell lines. SK-OV-3 (A), Caov-3 (B), IGROV-1 (C) or OV2008 (D) cells were cultured in the presence of 20 μM mifepristone (MF) for the indicated times and the number of viable cells was recorded. In E, a dose response experiment is depicted for SK-OV-3 and OV2008 cells. Because SK-OV-3 and OV2008 have a different pattern of growth, the results of this experiment, in order to be combined within one diagram, are displayed as percent of vehicle-treated control, whose growth was considered to be 100%.
