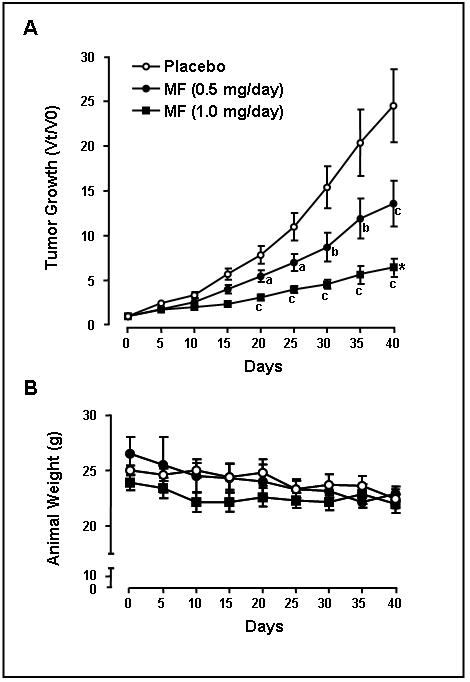
Fig. 6.

Effect of mifepristone on tumor growth in vivo. A, growth curve for SK-OV-3 tumors in nude mice that were treated with placebo (open circles), 0.5 mg/day mifepristone (closed circles), or 1 mg/day mifepristone (closed squares). Tumor sizes are expressed as relative volume at a particular time (Vt) divided by its volume at the beginning of the treatment (V0) on day 0. a, P < 0.05; b, P < 0.01; and c, P < 0.001 compared to its time-matched placebos, and * P < 0.05 compared with mifepristone-treated at 0.5 mg/day. B, body weights were stable during treatment and similar for the placebo-treated (open circles), mifepristone-treated at 0.5 mg/day (closed circles) or mifepristone-treated at 1 mg/day (closed squares) animals.
