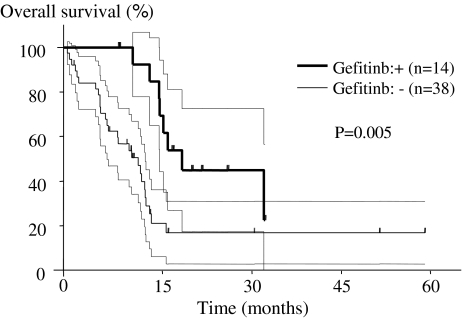
Fig. 4.
A Kaplan–Meier curve of overall survival based on absence or presence of gefitinib treatment is illustrated. The dotted lines indicate the 95% confidence interval. The mean survival is longer (p = 0.005) in the group treated with gefitinib than in the untreated group among 52 patients with adenocarcinoma and PS 1 or less.

