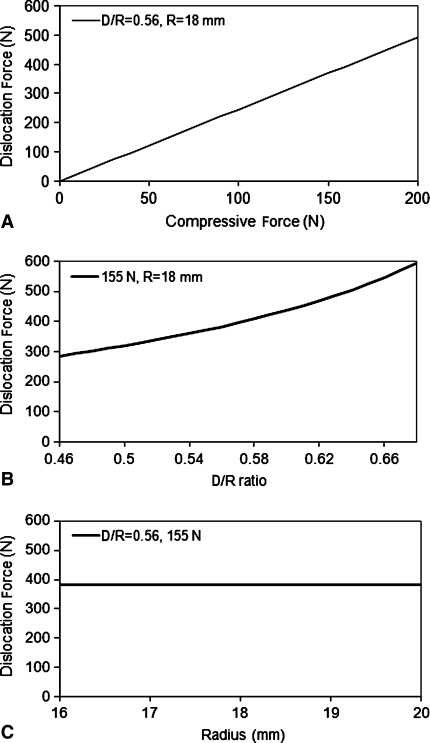
Fig. 8A–C.
The graphs show the trends present when the analytical model for RSA stability is used to calculate dislocation force. (A) This graph shows how the force it takes to dislocate the glenosphere from the humerosocket increases linearly as a function of increasing the compressive force applied. (B) This graph shows how the force it takes to dislocate the glenosphere from the humerosocket increases exponentially as a function of increasing the depth of the humerosocket, represented by the d/R ratio. (C) This graph shows how the force it takes to dislocate the glenosphere from the humerosocket remains constant as a function of increasing the radius of the glenosphere.

