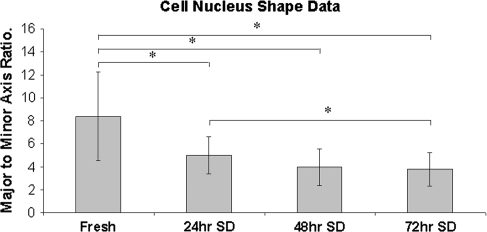
Fig. 3.
The bar graph shows the decrease in cell nuclear aspect ratios seen in stress-deprived tendons as a function of time. The decrease in the ratio of major axis length to minor axis length reflects the “rounding” up of the cells in response to the loss of homeostatic strain. The symbol (*) signifies significant (p < 0.05) differences between specific groups.

