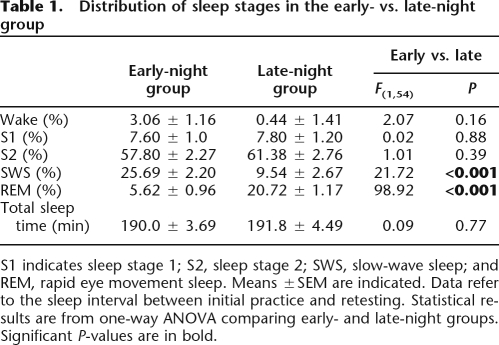
Table 1.
Distribution of sleep stages in the early- vs. late-night group
S1 indicates sleep stage 1; S2, sleep stage 2; SWS, slow-wave sleep; and REM, rapid eye movement sleep. Means ±SEM are indicated. Data refer to the sleep interval between initial practice and retesting. Statistical results are from one-way ANOVA comparing early- and late-night groups. Significant P-values are in bold.

