
Figure 4.
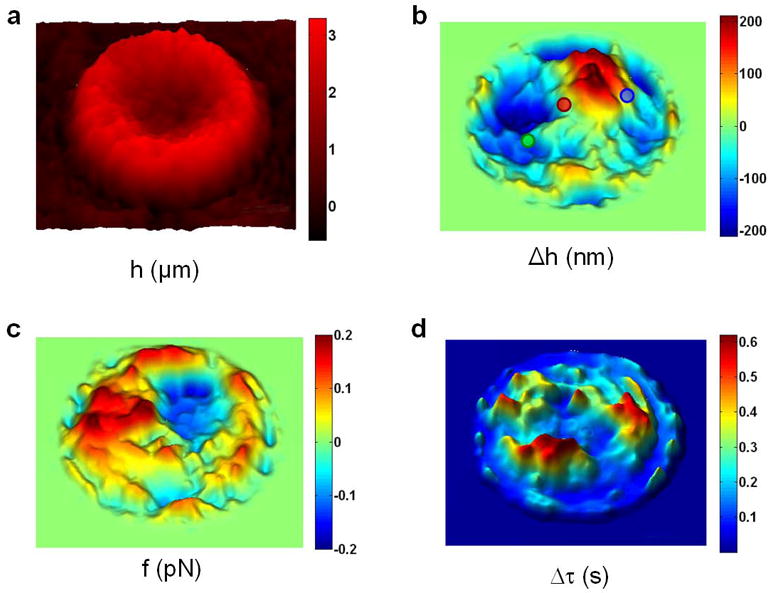
Dynamic images of RBCs provided by the DPM instrument. (a) Physical map of a normal RBC. (b) Instantaneous displacement map of the cells in panel a shows areas with relatively little displacement over time (red circle), while other areas show net positive (blue circle) or negative (green circle) displacement over the course of these measurement. (c) The instantaneous restoring force f and (d) the temporal (τ) coherence map reveal other spatially-resolved RBC dynamic quantities. The color bars show z-axis scale in respective units for each panel. Figure adapted from [17].