Figure 1.
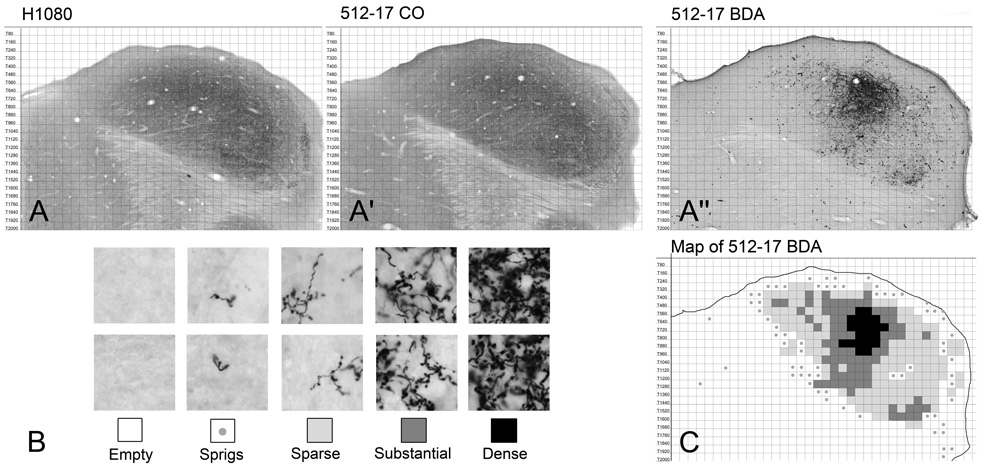
Methods used to represent the distribution and density of terminal labeling. A-A”. Horizontal sections through the approximate middle of the IC. A. Section H1080 from an IC atlas (Cant and Benson, 2005) reacted for cytochrome oxidase. A’. Comparable CO-reacted section through the IC in case 512. A”. BDA-reacted section adjacent to the CO section in panel A’. B. Criteria used to summarize the extent of terminal label. Each grid square that contained labeled elements was scored as follows: sprigs, no more than one piece of an axon or questionable whether labeling was present; sparse, only a few axons or terminals present. The two examples represent the maximum amount of labeling that would have received this score. This designation was also used for grid squares that contained only axons and no terminal labeling (e.g., in the lateral lemniscus); substantial, labeled terminals cover a large portion of the grid square; dense, labeled terminals fill the grid square making individual boutons difficult or impossible to resolve. C. Map for the section shown in panel A”. Grid squares are filled according to the density of labeling as defined in panel B.

