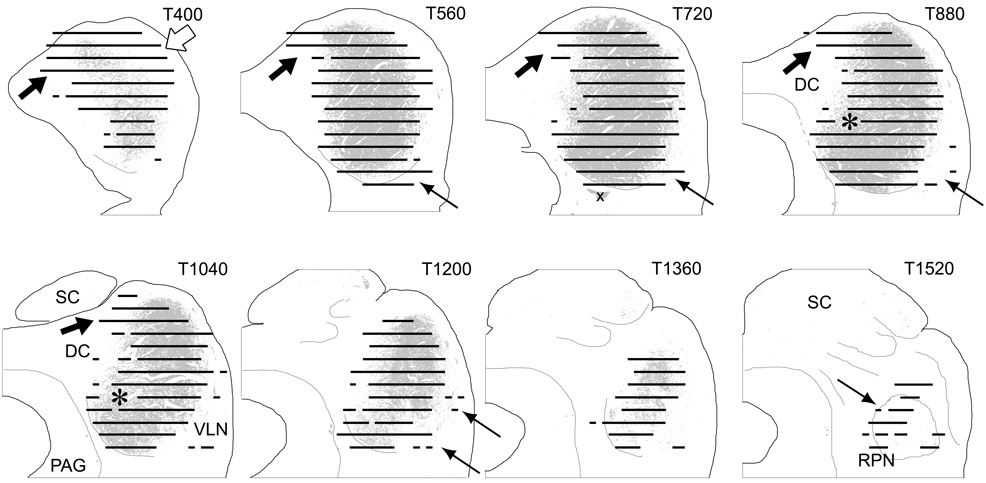
Figure 6.
Representation of the terminal field formed by projections from the cochlear nuclei with respect to the boundaries of the CNIC. Results from ten cases were pooled and plotted onto atlas sections cut in the transverse plane. Sections from the IC atlas are arranged with the most caudal section (T400) in the upper left panel and the most rostral section (T1520) in the lower right panel. Areas occupied by “dense” or “substantial” label in at least one of the cases are depicted by the black lines drawn at each of the 13 horizontal levels included in the analysis. The CNIC is indicated by the gray fill on each section. Arrows indicate areas outside the CNIC that contain labeled terminals; asterisks indicate a small area within the CNIC that did not contain substantial labeling in any of the cases. The x on level T720 indicates a staining artifact.

