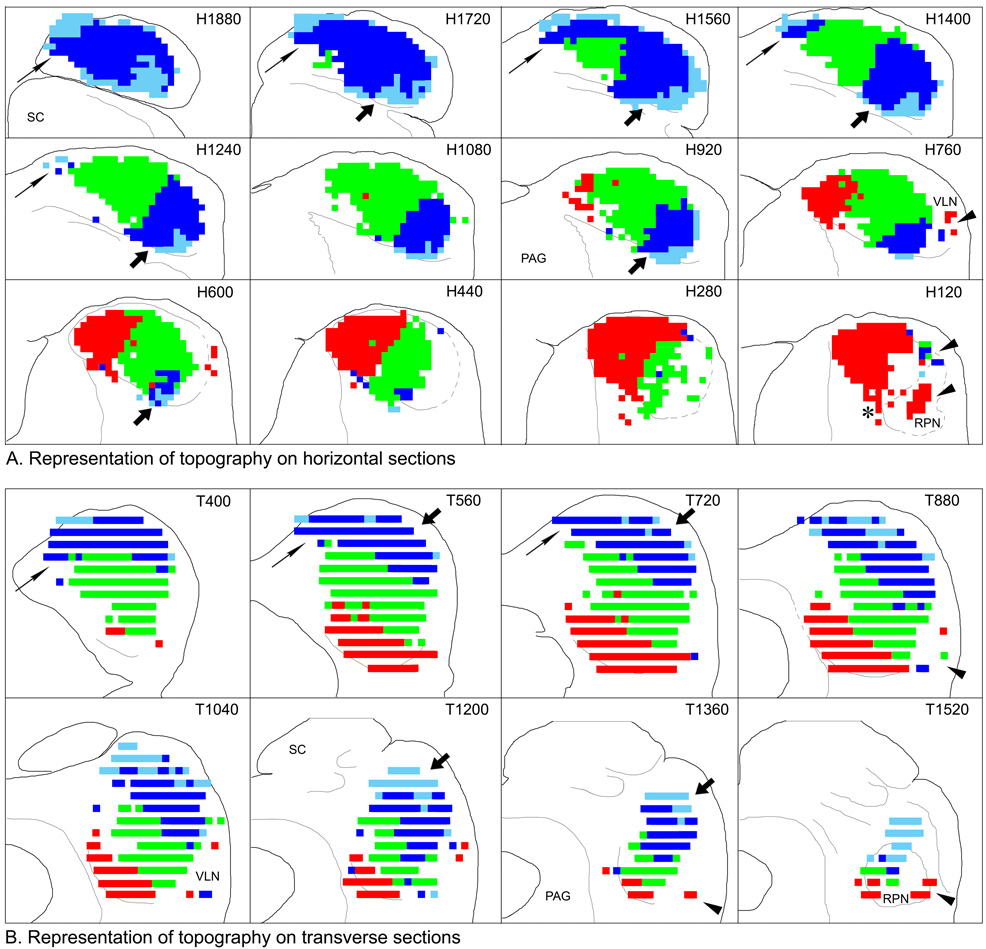
Figure 7.
Representation of the topographic (and presumed tonotopic) organization of the projections from the cochlear nucleus to the inferior colliculus. A. Topographic organization in the horizontal plane plotted on the IC atlas. The most dorsal section (H1880) is in the upper left panel; the most ventral section (H120) is in the lower right panel. Caudal is toward the top; lateral is toward the right. B. The data plotted in panel A re-plotted onto transverse sections from the IC atlas. The most caudal section (T400) is in the upper left panel; the most rostral section (T1520) is in the lower right panel. Dorsal is toward the top; lateral is toward the right. The maps were color-coded based on the distribution of terminal label as described in the text. Only dense and substantial labeling were considered in constructing the maps. Symbols are referenced where appropriate in the discussion.

