
Figure 3.
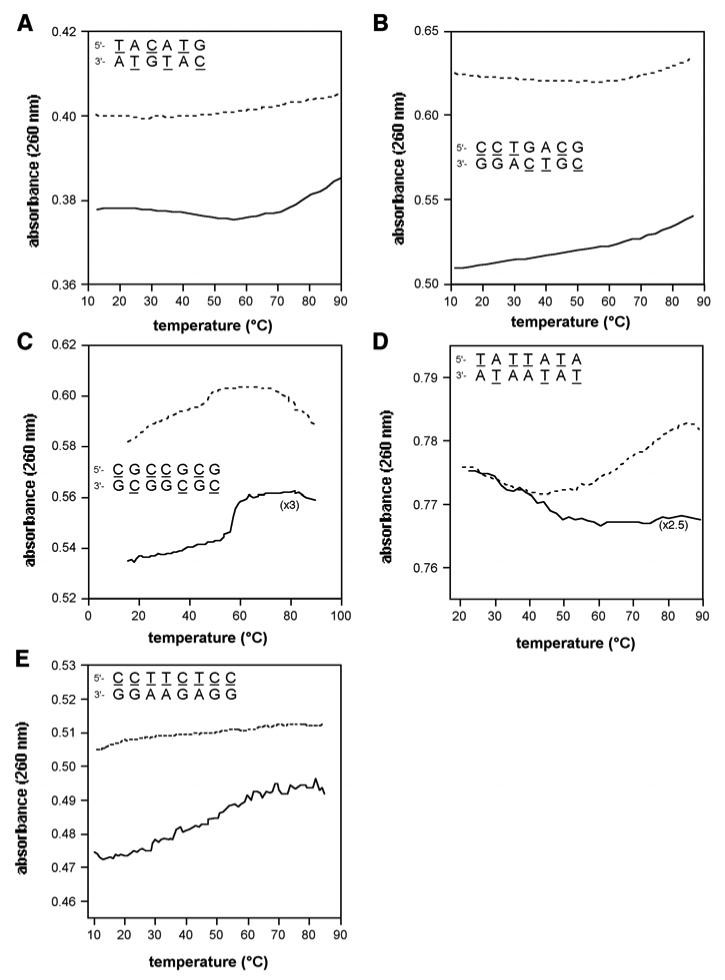
Changes in thermal denaturation behavior on mixing of complementary yyDNA strands. Shown are UV-monitored denaturation plots of mixed strands (sequences shown) involving yyDNA bases (solid lines), with comparison to the mathematically added data for denaturation of the component single strands (dashed lines). See Figure S3 (Supporting file) for controls.