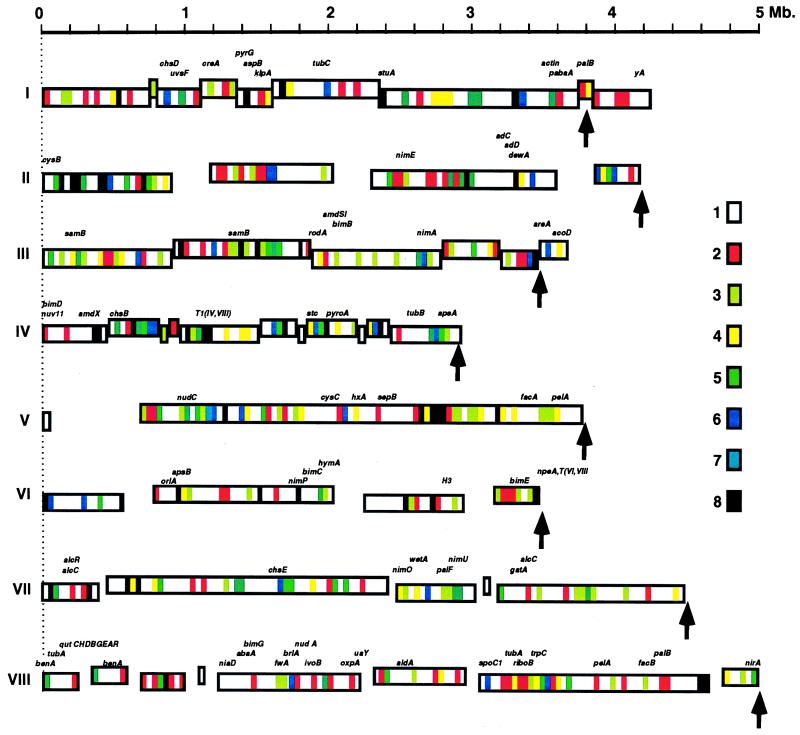
Figure 4.
Distribution of repeated DNA sequences in the A. nidulans genome is nonrandom. Physical maps of individual chromosomes are listed across the rows and contigs represented by rectangles that correspond to their estimated sizes (in megabases). Contig rectangles are vertically offset to allow them to be easily distinguished. Arrows indicate the predicted chromosomal size from pulsed field gel electrophoresis. Gaps are indicated by empty spaces between contigs and were evenly distributed because we cannot determine, at this time, the exact position of contigs along the chromosomes. The individual sizes of gaps are unknown. Chromosomal regions containing repeated DNA sequences that are shared by eight or fewer chromosomes are indicated by the color-coded boxes.

