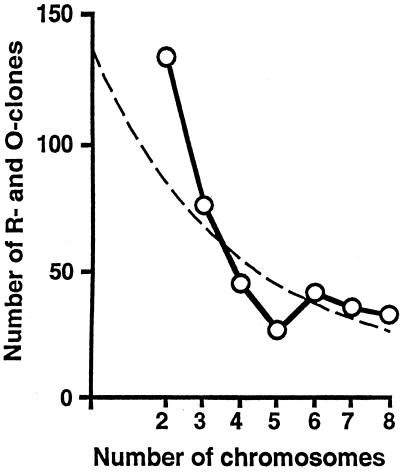
Figure 5.
Repeats shared by two, three, or more chromosomes decrease in an exponential-like fashion. Distribution of R and O clones that hybridize to two, three, and up to eight chromosomes is shown. The data points are (2, 133), (3, 76), (4, 45), (5, 26), (6, 41), (7, 35), and (8, 32). Dashed line shows the fitted exponential curve for comparison (r = 0.808).

