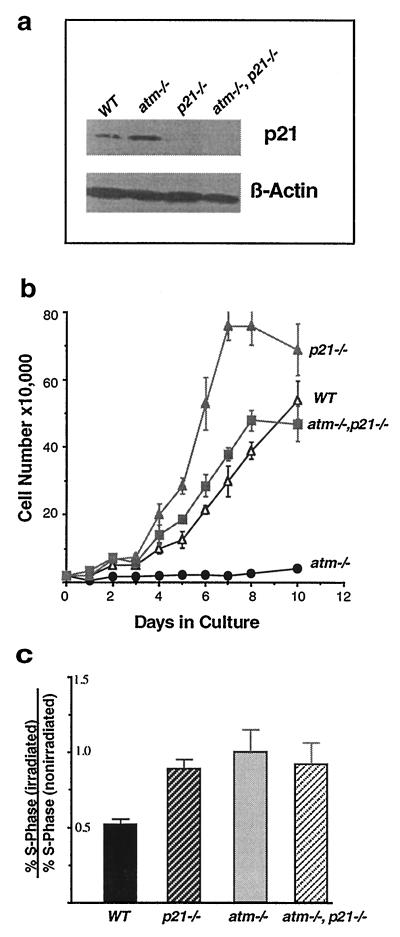
Figure 1.
Cell proliferation and cell cycle analysis. (a) Western blot analysis of cell lines used in this study. Lane 1, wild-type MEF cells. Lane 2, atm null MEF cells. Lane 3, p21 null MEF cells. Lane 4, atm/p21 double-null MEF cells. Increased expression of p21 is seen in atm null as compared with wild-type cells. p21 expression is not seen in both p21 null and atm/21 double-null cells. A β-actin control for equal loading also is shown. (b) Saturation densities and growth properties of the MEFs. MEFs (2 × 10⁴) at passage 4 were plated in triplicate on 35-mm culture dishes, and medium was changed every day. The cell number at each time point represents the mean value of triplicates with an error bar showing standard deviation. The genotype of each cell line is indicated. atm/p21 double-null cells grow at a similar rate to wild type but slower than p21 null cells and also arrest at a lower saturation density. (c) G1/S checkpoint defect in atm/p21 double-null MEFs in response to ionizing radiation. Unsynchronized atm, atm/p21, p21, and wild-type MEFs were irradiated at 0 and 10 Gy. Fourteen hours after irradiation, cells were pulsed with 10 μM of BrdUrd for 4 hr. Cells were fixed and stained with anti-BrdUrd antibody and propidium iodide and analyzed by FACS for S-phase and DNA contents. Three independent experiments were performed at the indicated dosage. The ratios of the percentage of irradiated S-phase cells versus the percentage of nonirradiated S-phase cells are presented with error bars showing standard deviations. Solid bar, wild type; dark hatched bar, p21/p21; light solid bar, atm/atm; light hatched bar, atm/p21.

