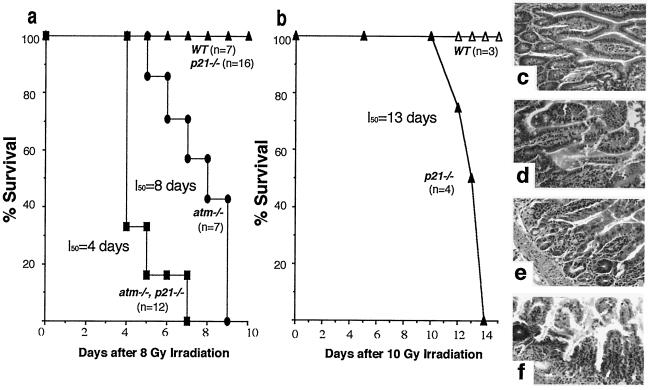
Figure 2.
Acute radiation hypersensitivity in atm/p21 double-null mice. Survival curves are shown of mice irradiated at (a) 8 Gy and (b) 10 Gy. Statistical analysis was performed by using Wilcoxon two-sample test assuming nonparametric data and a two-tailed P value (P < 0.002). Genotypes of mice are indicated. Data in a are combined from two separate sets of experiments. Hematoxylin and eosin-stained sections of the small intestine taken at day 3 after 8 Gy irradiation are shown in c-f at ×40 magnification. (c) Wild type. (d) p21/null. (e) atm/null. (f) atm/p21 double null. p21 null mice irradiated at 10 Gy show edematous degeneration of small intestine 3 days postirradiation (data not shown).

