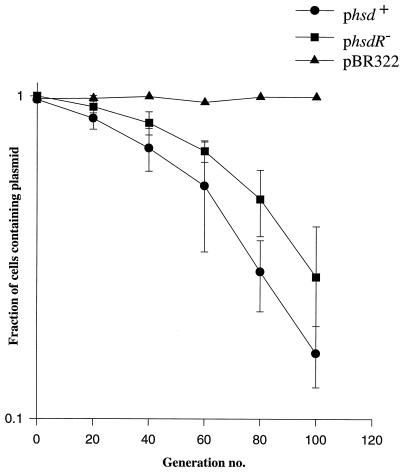
Figure 2.
The maintenance of plasmids phsd+ and phsdR− in NM679 compared with pBR322 (see Materials and Methods). The fractions of cells retaining plasmids are plotted on a log scale. Those for phsd+ and phsdR− were based on the data of three experiments and those for pBR322 on two. No standard deviations are shown for the latter because there was negligible deviation.

