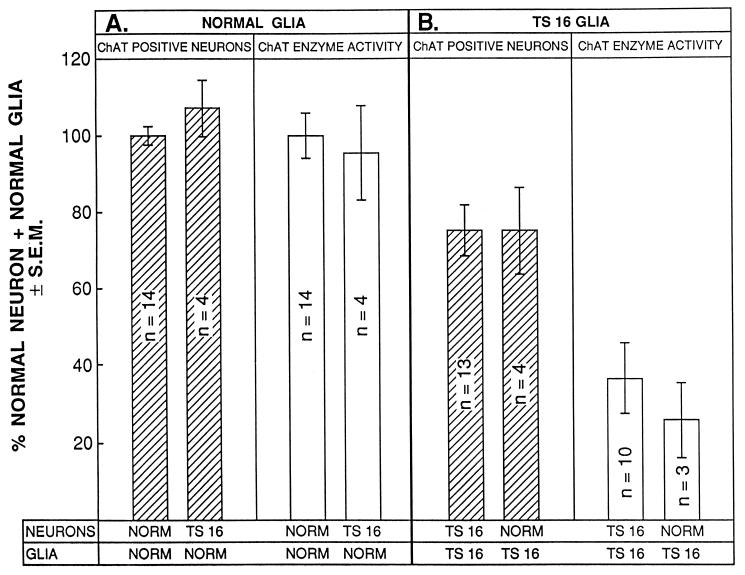
Figure 3.
Plots of the ChAT enzyme levels and cholinergic neuron number in homologous and heterologous cultures expressed as % of NG+NN. For the homologous cultures, the values are taken from Table 1; for the heterologous cultures (TG+NN and NG+TN), the data are taken from cultures with the lowest neuron density in each series of experiments.

