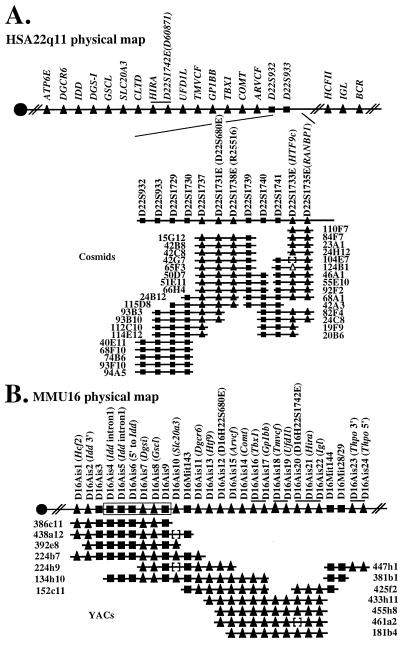
Figure 2.
Physical map of a portion of MMU16 and HSA22q11. The markers used to construct the physical maps are indicated above the line representing either a portion of HSA22q11 (A) or MMU16 (B). For expressed sequences, the name of the gene or EST has been added in parentheses. The YAC and cosmid clones were ordered based upon the presence of genes (triangles) and monomorphic STS markers (squares). Closed symbols represent the markers that were tested and that are present on a particular clone, and open symbols represent markers that were not tested for the particular clone. The distance between each marker is arbitrary and does not reflect the actual physical distance. (A) Partial physical map of HSA22q11. The line at the top presents the relative order of genes from HSA22q11 as determined by high resolution physical mapping (6, 7). The markers used to extend the physical map are indicated above the line representing the region mapped in this study. (B) Physical map of the mouse region homologous with HSA22q11. A line above the symbols identifies genes or markers for which the relative order is not known. Order of markers D16Ais4 to D16Ais9 was inferred from the published 38-kb sequence of a portion of MMU16 (60).

