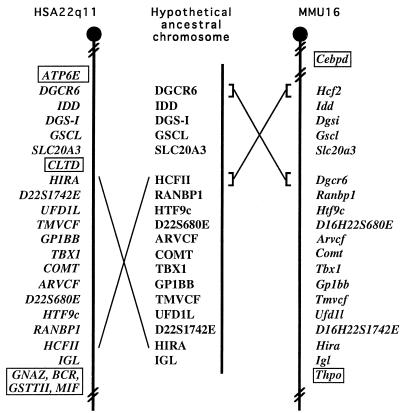
Figure 3.
Comparison of the human VCFS/DGS region with the homologous region in mice. On the left is represented the relative order of genes from the HSA22q11 (this paper and refs. 6, 7, and 10). On the right is represented the relative order of genes in the homologous region in mice as shown by physical and genetic mapping. The distance between each marker is arbitrary. The middle portion of the figure shows the gene order of a hypothetical, ancestral chromosome and possible recombination events leading to the differences in the gene order in mice and humans (see text for details). Gene names within boxes in the map of one species indicate genes that are not present in the homologous region of the other species.

