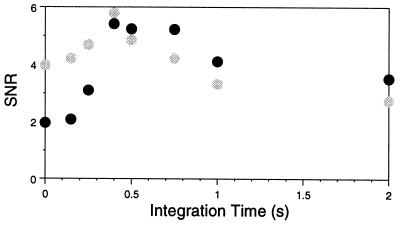
Figure 3.
Temporal integration of optic-nerve responses by neurons in the first synaptic layer of the brain. The gray and black symbols plot the signal-to-noise ratio (SNR) of simulated responses of brain neurons to moving images of the gray and black objects in Fig. 2, respectively, as a function of synaptic integration time. SNR is defined as the peak-to-peak response modulation of neurons viewing the objects relative to twice the standard deviation of response modulations of the rest of the network.

