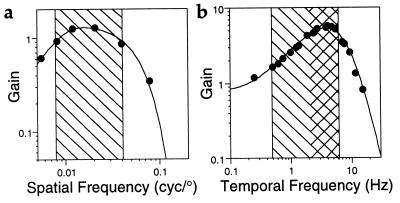
Figure 4.
Spatiotemporal response properties of the lateral eye. (a) Spatial transfer function. Gain of the response of a single optic nerve fiber plotted as a function of the spatial frequency of a drifting sinusoidal grating. Negative slope lines denote the frequency band corresponding to crab-size objects at the range of distances which Limulus detect potential mates in their natural habitat (0.25–1.4 m). (b) Temporal transfer function. Response gain plotted as a function of the frequency of a flickering spot that fills the field of view of the recorded ommatidium. Positive slope lines denote the frequency band corresponding to animal velocities over the range of distances of mate detection (0.5–6 Hz). Negative slope lines give the frequency range of strobic lighting (2–6 Hz) in the animal’s natural underwater environment.

