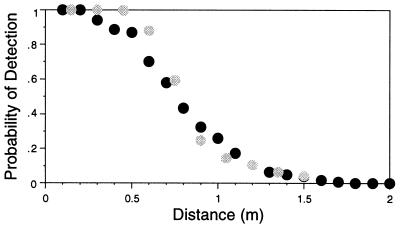
Figure 5.
Comparison of the visual performance of horseshoe crabs to that predicted from the computational model. Black symbols replot from a behavioral study (13) the probability of crabs turning toward a black crab-size object as a function of the distance from the object. Gray symbols plot the visual performance of an ideal horseshoe crab predicted from optic nerve responses computed by the model. We assume that the ideal horseshoe crab moved past the object at an average speed of 15 cm/s and water turbidity decreased the object’s contrast with distance (see Materials and Methods). We use signal detection theory to estimate the probability of detecting the computed optic nerve responses in the presence of noise. A coefficient of variation of 0.1 in firing rate noise and a threshold for detection permitting a 1% false-alarm rate provided the best description of the measured visual performance. The higher coefficient of variation measured in the field (0.2) suggests that the decision maker in the crab brain pools the activities of a small cluster of optic nerve fibers (≈4), which is consistent with the number of ommatidia viewing the object at behavioral threshold (13, 14). Significantly different estimates of visual performance require at least a 10-fold change in detection threshold or a 2-fold change in noise level.

