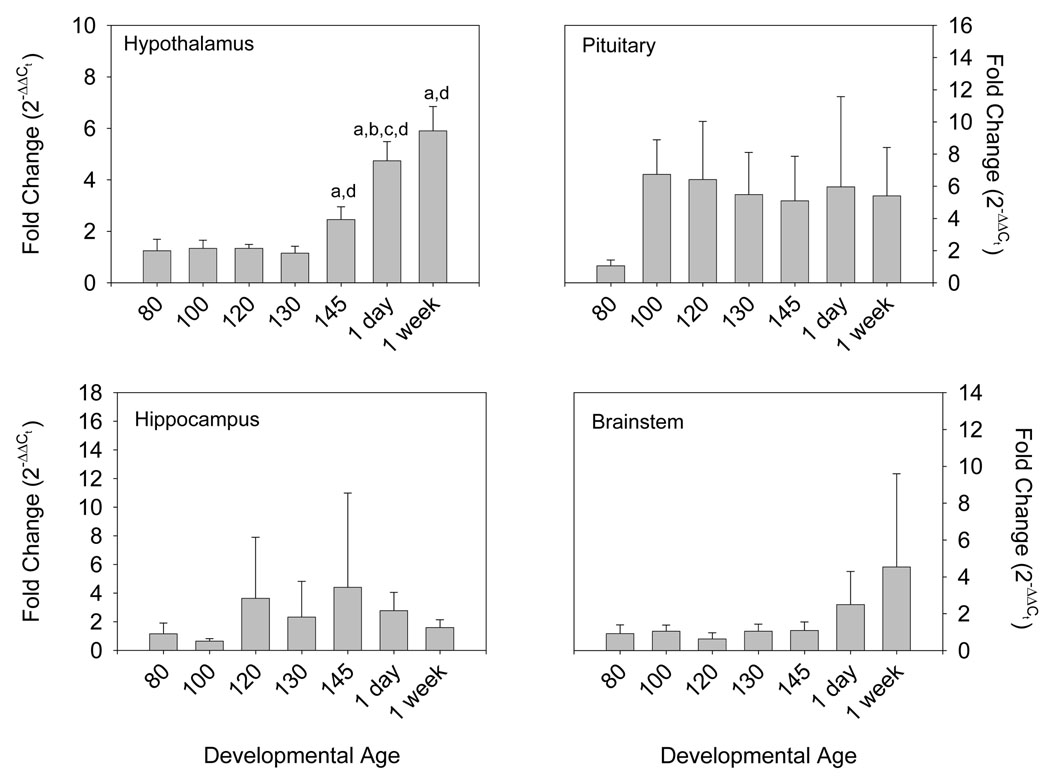
Figure 1.
Ovine Androgen Receptor mRNA abundance in hypothalamus (panel A), brainstem (panel B), hippocampus (panel C), and pituitary (panel D) from 80, 100, 120, 130, and 145 day gestation fetal sheep and 1 and 7 day postnatal lambs (n=4–5 per group). Data are expressed as fold change relative to 80 day fetal sheep. Data are represented as mean values ± 1 SEM. “a” represents statistically significant difference from 80 day gestation fetal sheep, “b” represents significant difference from 100 days, “c” represents significant difference from 120 days, and “d” represents significant difference from 130 day gestation fetal sheep.

