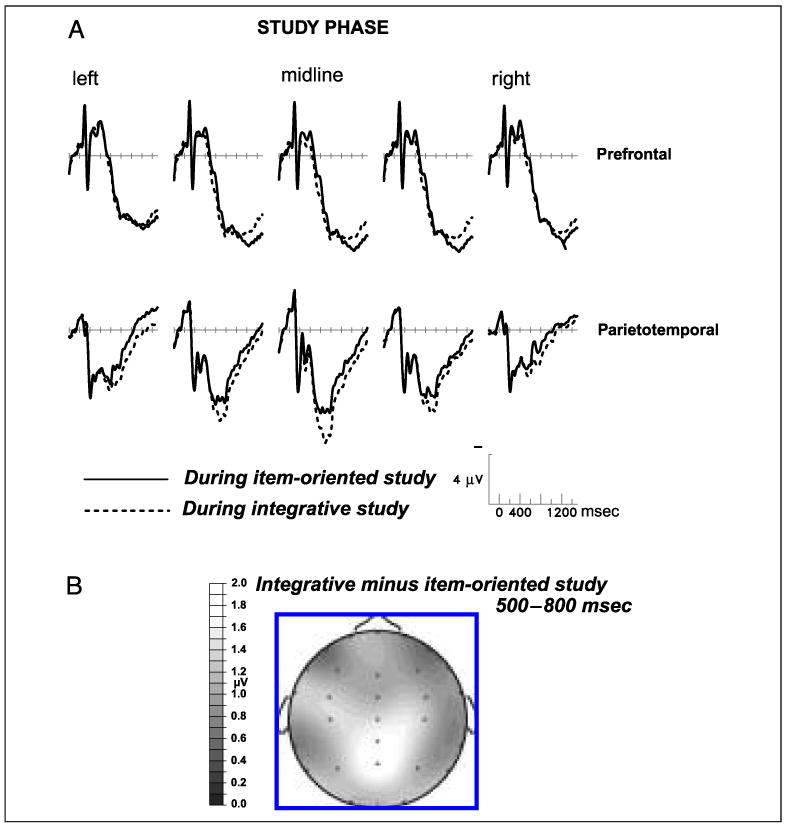
Figure 2.

(A) Grand-average ERPs from 24 subjects performing the size judgment (item oriented) and color congruity (integrative) tasks during the study phases. From left to right, the prefrontal scalp sites are Fp5, Fp1, Fpz, Fp2, and Fp5, and the parietotemporal sites are T5, P3, Pz, P4, and T6. (B) Topographic map showing the spatial distribution of the significant difference between the two study tasks from 500 to 800 msec after stimulus onset; earlier (200–500 msec) and later (800–1200 msec) latency windows showed no statistically significant differences. Negative voltage is plotted upward in this and all subsequent figures.
