Fig. 3.

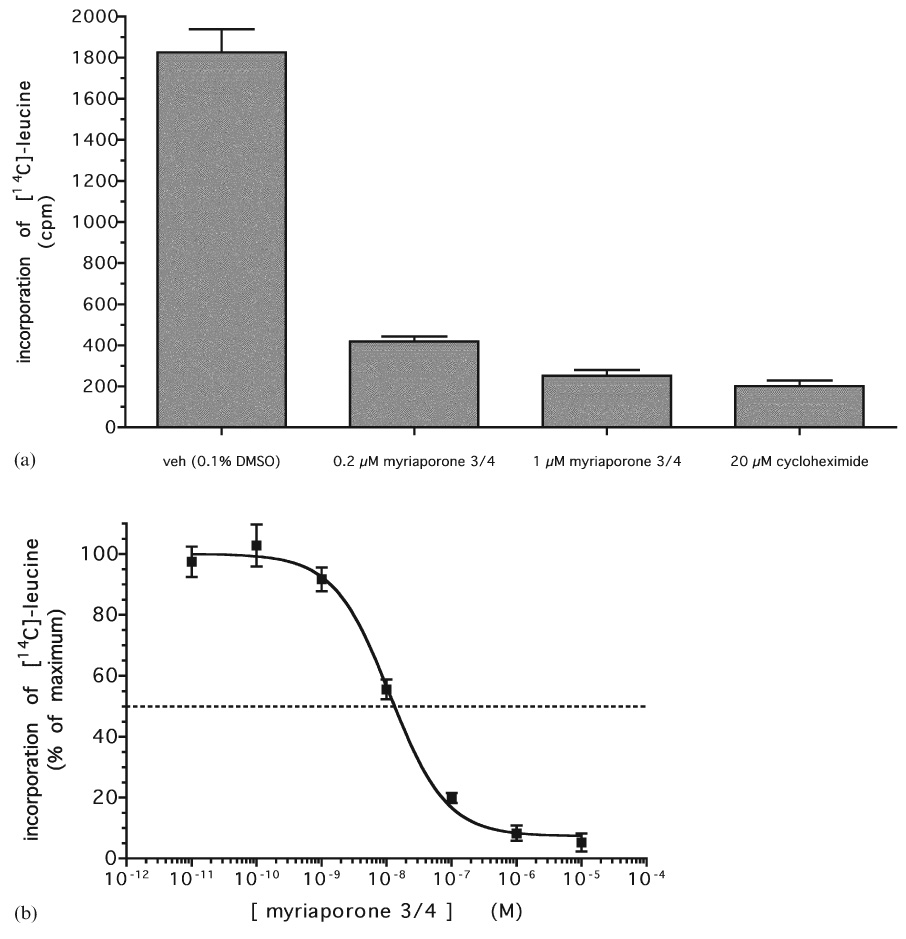
(a) Inhibition of in vivo protein synthesis by myriaporone 3/4. Endothelial cells were pre-treated with myriaporone 3/4 for 3 h, followed by another 3 h in the continued presence of the drug plus 1 µCi ml−1 [14C]-leucine. Graph represents the averaged results of three independent experiments (error bars represent the standard error of the means). (b) Dose–response of myriaporone 3/4 inhibition of protein synthesis. Graph represents the averaged results of three independent experiments (error bars represent the standard error of the means).
