
Figure 2.
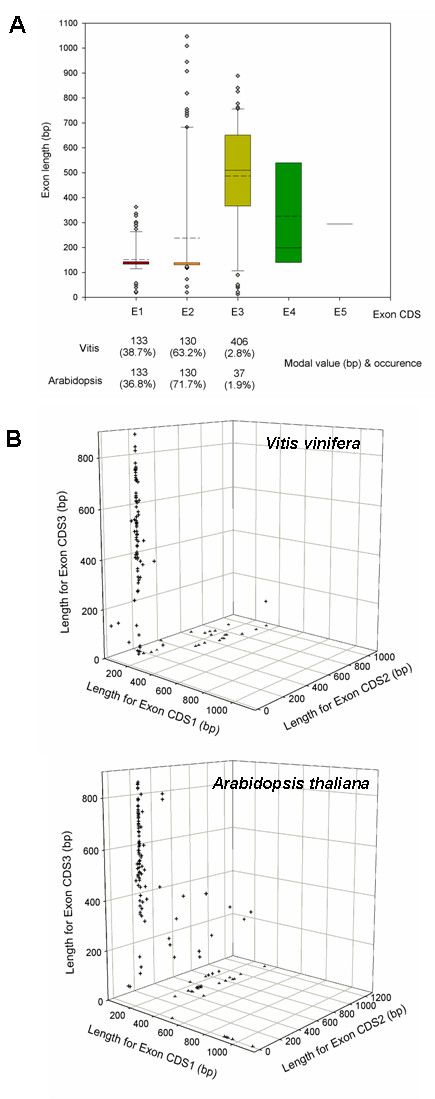
Exon length distribution analysis of the grape R2R3 MYB gene models. A) Exon length values were analysed using Boxplot. Each box represents the exon size range in which 50% of the values for a particular exon are grouped. The mean value is shown as a dotted line and the median as a continuous line. Only eight gene models possess four exons while two genes are predicted to have five. B) Distribution of grape and Arabidopsis MYB genes regarding their first, second and third exon lengths.