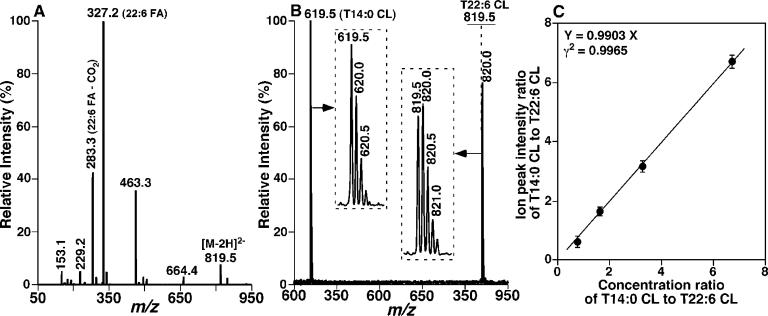
Figure 2.
Electrospray ionization mass spectrometric analyses of synthesized tetra22:6 cardiolipin. (A) Product ion mass spectrum of m/z 819.5, from which the selected ion can be identified as T22:6 CL. (B) Representative negative-ion ESI mass spectrum of an equimolar mixture of T14:0 CL and T22:6 CL (1 pmol/μL each). The insets display the isotopologue patterns of the ions. The horizontal line over the ion peak at m/z 819.5 represents the monoisotopic ion peak intensity after 13C de-isotoping and has been normalized to that at m/z 619.5. (C) Linear correlation between the concentration ratios and the ion peak intensity ratios of T14:0 CL and T22:6 CL. The data points represent the mean ± SD determined at a variety of concentrations. These results indicate that the ionization response factors of T14:0 CL and T22:6 are essentially identical within experimental errors after 13C de-isotoping.

