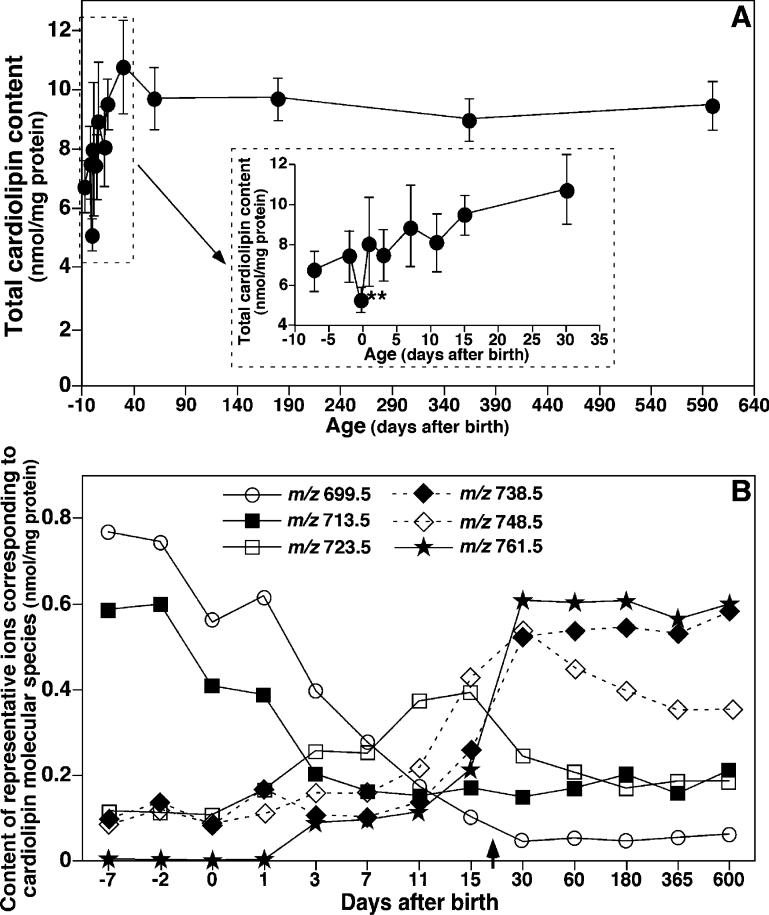
Figure 4.
Temporal changes in the contents of total CL and representative CL molecular species in lipid extracts of mouse cortex. Lipid extracts of mouse cortex at different ages before and after birth were prepared using a modified Bligh and Dyer method. The content of each individual CL molecular species after identification were calculated in comparison to the selected internal standard after 13C de-isotoping as described under the Materials and Methods. (A) Temporal changes in the content of total CL, which was summarized from the determined contents of individual CL molecular species in mouse cortex before and after birth. The inset of A displays the region of the graph during the pre- and postnatal periods. (B) Temporal changes in the levels of multiple CL molecular species (as indicated and representative of the different mass regions) in lipid extracts of mouse cortex before and after birth. It should be noted that the scale of the x axis in B is random and represents the days when the animals were sacrificed after birth. Negative signs represent the number of days before birth. The data points represent mean ± SD from separate preparations of at least four different animals. The error bars in B are within the symbols. The arrow in B indicates the weaning time.

