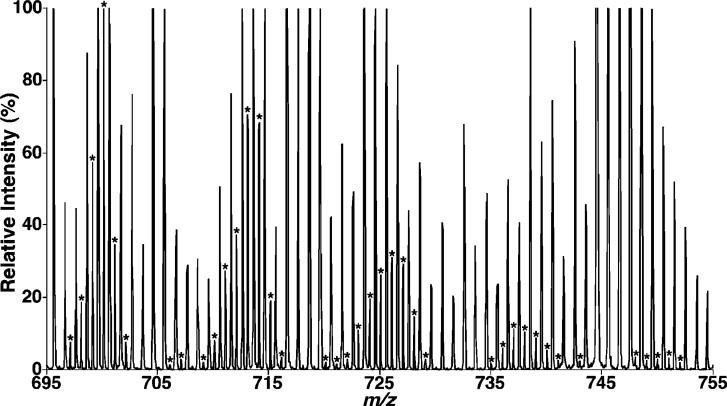
Figure 8.
Expanded negative-ion ESI mass spectrum of lipid extracts of primary neuronal cultures using a QqTOF mass spectrometer. Lipid extracts of cultured cells were prepared by a modified Bligh and Dyer procedure, and an ESI mass spectrum was acquired in the negative-ion mode using a QqTOF mass spectrometer as described under the Materials and Methods. The asterisks indicate the recognizable CL plus-one isotopologues, which were characteristic of doubly charged CL molecular species and were used to quantify individual CL molecular species based on ion intensity as previously described (10). The spectrum is displayed after being normalized to the most abundant CL plus-one isotopologue.

