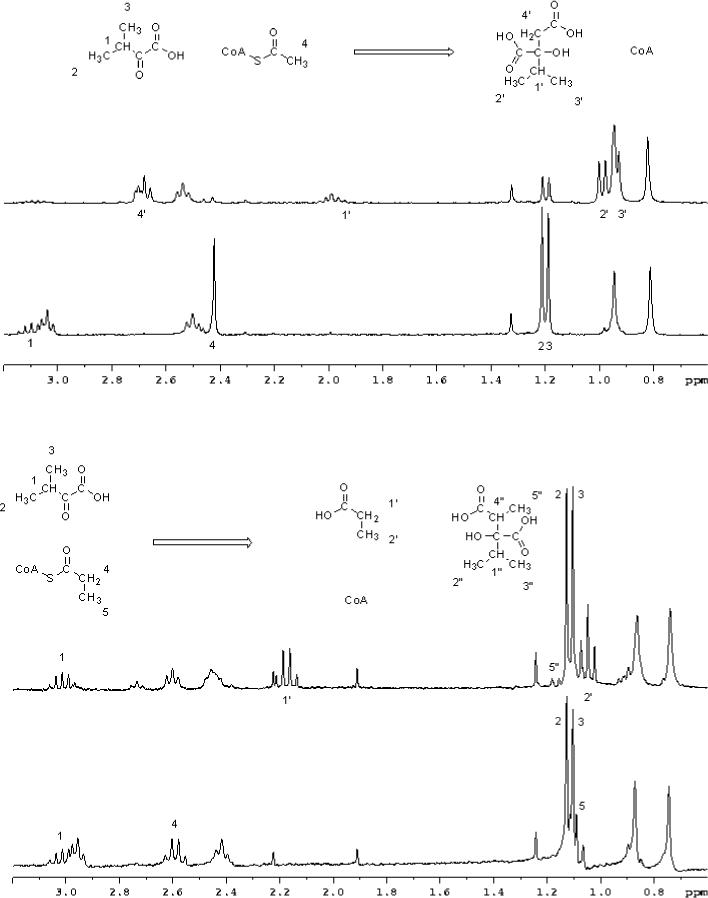
Figure 1. 1H-NMR analysis of the reaction of MtIPMS.

(A) Region of spectral interest of the reaction of MtIPMS with AcCoA and α-KIV. Reaction mixture without enzyme (bottom spectrum) and reaction after reaching completion (top spectrum). (B) Region of interest of the spectra of reaction of MtIPMS with propionyl-CoA and α–KIV. Reaction mixture without enzyme (bottom spectrum) and reaction after reaching completion (top spectra). Although data was recorded throughout the experiments only the last spectrum is shown in each case.
