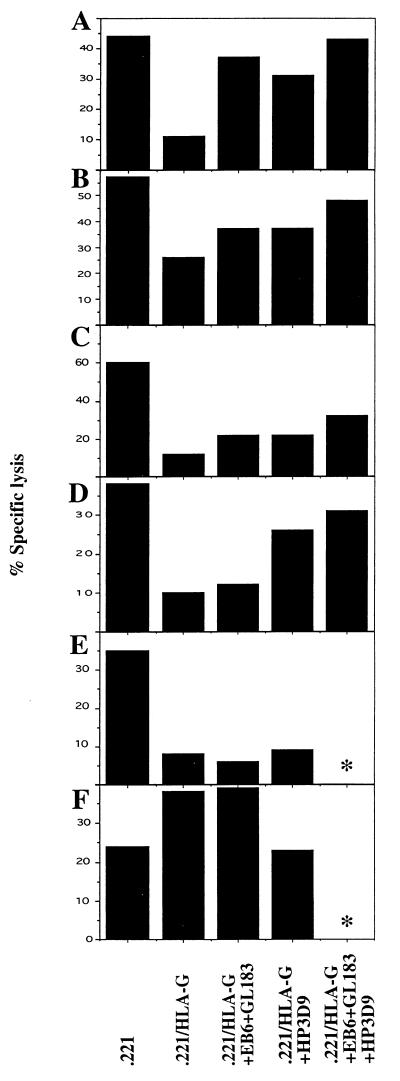
Figure 1.
Phenotypes among 59 NK cell lines established from one individual. See text for description of phenotypes and frequency of each. The E:T ratio used in the assay was 3:1 and the concentration of each mAb added was 5 μg/ml (targets and mAb listed at the bottom). ∗, Not done, amounts of NK cells were limiting.

