Figure 3.
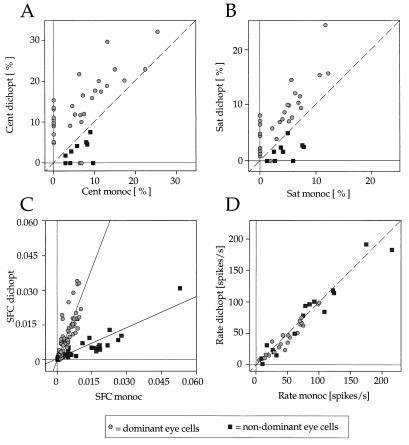
(A) Scatter plot of RMA values of the center peak (Cent) of CCHs under monocular (abscissa) vs. dichoptic (ordinate) stimulation conditions for recording pairs connected to the dominant (circles) and nondominant (squares) eye. (B) Scatter plot of RMA values of the first satellite peaks (Sat) in CCHs. Same conventions as in A. (C) Scatter plot of SFCs (see Materials and Methods) between 39 and 63 Hz of STAs during monocular (abscissa) vs. dichoptic (ordinate) stimulation. Circles and squares refer to STAs computed for recording sites driven by the dominant and nondominant eye, respectively. Regression lines were calculated separately for STAs computed between responses evoked from the dominant and nondominant eye, respectively, and have slopes of 2.6 (R2 = 0.8, P < 0.0001) and 0.4 (R2 = 0.7, P < 0.0001), respectively. (D) Scatter plot of average firing rates (evoked minus ongoing activity) under monocular (abscissa) and dichoptic (ordinate) stimulation conditions. Circles and squares represent responses evoked from the dominant and nondominant eye, respectively.

