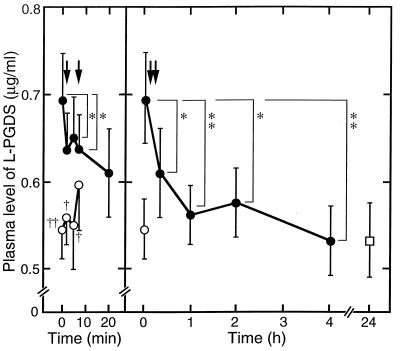
Figure 4.
Changes in the L-PGDS (β-trace) concentration in plasma obtained from the great cardiac vein (solid circles), the entrance of the coronary artery (open circles), and the peripheral vein (open square) before and after PTCA of patients with stable angina. Arrows indicate the inflation of a PTCA balloon. The data in the figure represent the average values ± SE. ∗, P < 0.05; ∗∗, P < 0.01 as compared with the L-PGDS level before PTCA. †, P < 0.05; ††, P < 0.01 as compared with the respective venous level.

