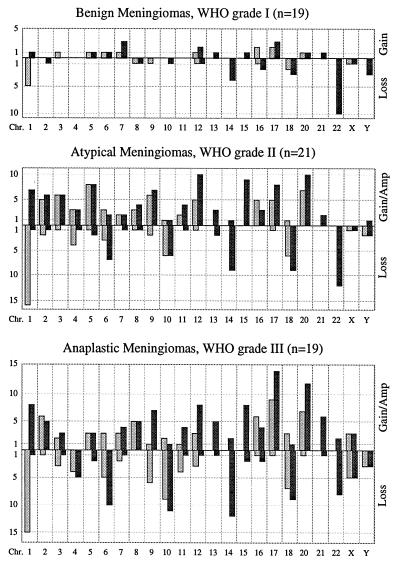
Figure 2.
Frequency of all CGH results obtained in the different meningioma groups. x axis, chromosomes 1–22, X, Y; y axis, number of cases. The bars showing upwards represent gains or amplifications on the short arms (shaded bars) or long arms (solid bars), whereas the bars pointing downwards stand for losses on the short arms (shaded bars) or long arms (solid bars) of the respective chromosomes.

