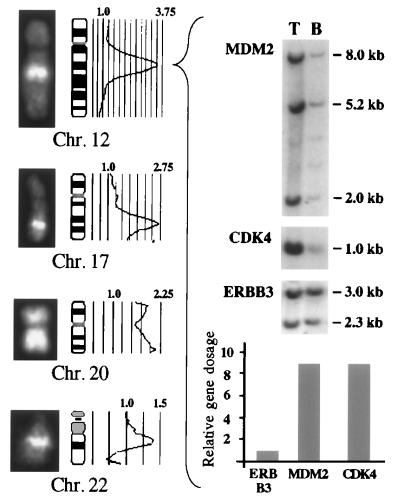
Figure 3.
Amplified DNA sequences were identified in MII and MIII and mapped to four different chromosomes by CGH. Shown are the images revealing the hybridization pattern of the tumor DNA (Left) next to the average ratio profile (Center). The value for the balanced threshold (1.0) and the highest threshold depicted are given for each profile. (Right) Southern blot analysis demonstrates that the genes found to be amplified on 12q were MDM2 and CDK4, which were amplified 9-fold as compared with the control locus ERBB3 (determined by densitometry; Lower Right).

