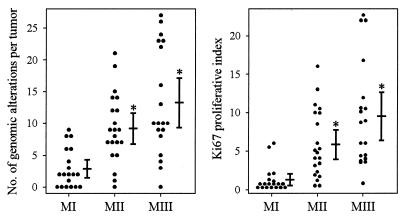
Figure 4.
(Left) Accumulation of genetic alterations during meningioma progression. All distinct genomic alterations detected in an individual tumor by the different methods used were added and are shown in their respective groups. (Right) Comparable increase of the Ki-67 proliferative index in MII and MIII versus MI. Beside the column of data points, the mean ± 2 SEM is given. ∗, Significant difference to values for MI (P < 0.05).

