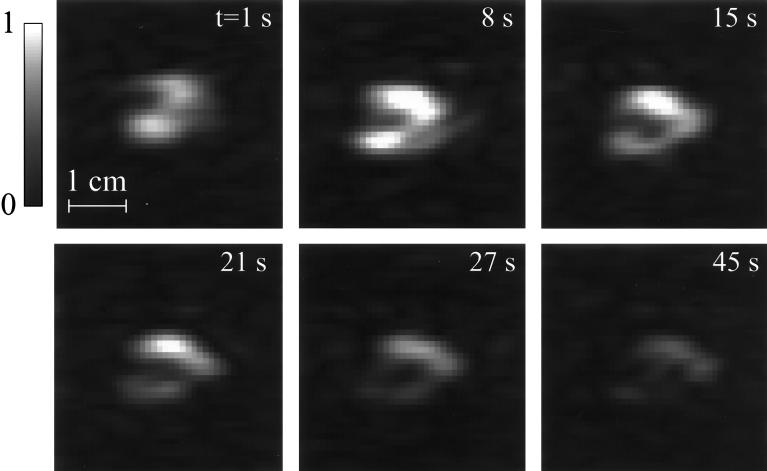
Figure 4.
129Xe MR images of an optically pumped xenon/saline solution injected into the upper hind leg of a living rat. Acquisitions began immediately after the beginning of an injection period of a few seconds, and they were taken at 1, 8, 14, 21, 27, and 45 s. Displayed image intensities were normalized to the second image. The sixth image was the first of the second series of acquisitions; the signal remained strong enough to be seen through the final acquisition, 70 s into the experiment. The peak signal-to-noise ratio, achieved in the second image, is about 16:1, and the ratio drops to about 8:1 in the sixth image. Images were acquired by using the FLASH sequence as shown in Fig. 2. Images as shown were prepared by zero-filling to give a 256 × 256 matrix and by applying a 50-Hz Gaussian apodization along the frequency-encoding dimension.

