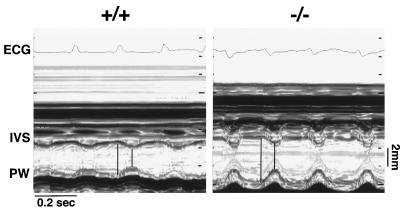
Figure 3.
M-mode echocardiographic tracings from an Npr1 +/+ and an Npr1 −/− mouse. ECG, electrocardiogram; IVS, interventricular septal wall; PW, posterior wall. The longer and shorter vertical bars illustrate the left ventricular end diastolic and end systolic dimensions, respectively. The ECG is used for timing purposes and, because it is not calibrated, cannot be used to assess conduction patterns.

