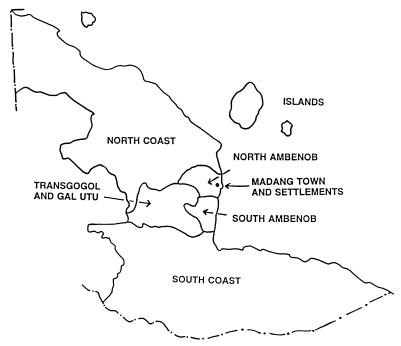
Figure 1.
Diagram of study area. Fewer children were recruited from regions distant from the hospital and, therefore, these children have been amalgamated into “North Coast,” “South Coast,” and “Islands.” The total population of each region according to the 1990 National Population Census and gene frequency for α− (± standard error) based on all children recruited in this study were as follows: Islands, 5,157 (0.50 ± 0.077); Madang Town and settlements, 4,346 (0.59 ± 0.019); North Ambenob, 1,477 (0.63 ± 0.026); North Coast, 10,665 (0.60 ± 0.028); South Ambenob, 2,285 (0.73 ± 0.021); South Coast, 17,859 (0.52 ± 0.039), and Transgogol and Gal Utu, 10,515 (0.64 ± 0.010).

